
The chart shows that Bursa has a good chance to at least turn up in the short term fom here.
This counter is co-related to the volume of the market. As the market is having good volume lately there is a good chance for this counter to turn up at least for the short term.
The three (3) arrows shown in the MACD, RSI and Stochastic chart seem to confirm that what I observe is true. MACD is about to form the golden cross and both RSI and Stochastic are in the lower area.
So it will be a good strategy to buy on weakness from now and sell it off when it hit the resistance shown by the upper parallel line.
This Bursa chart is added on 19.1.2010. It is a holiday to commemorate Thaipusam, so I am free to look at the chart I posted on 30th December 2010.
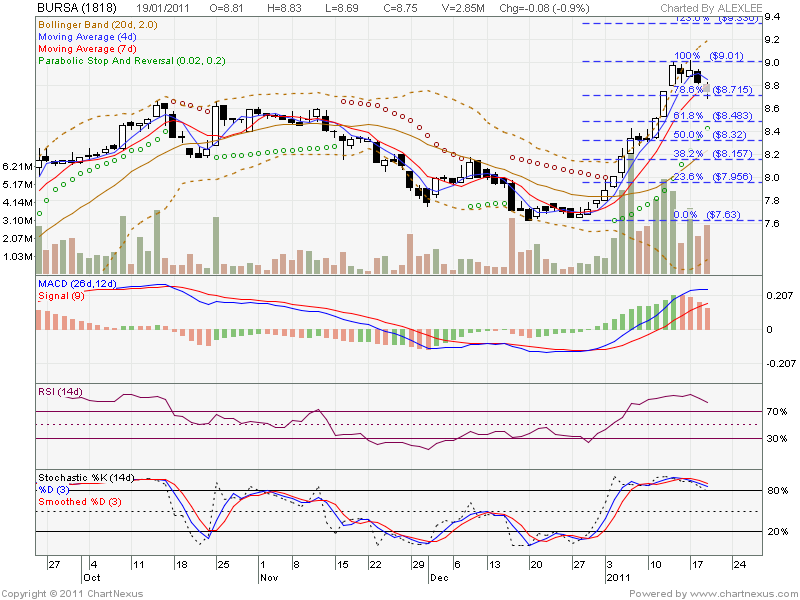
The price of Bursa has so far performed well from the day I suggested and now has started to turn down.
In fact it pierced through the upper resistance line then only it started to consolidate.
From now on, will there be a buying opportunity? To find the answer let us look at the Fibonacci retracement.
Right now it has retraced 78.6% (@RM8.72). The next retracement is at 50% (@RM8.32) and if this break down it may retrace to 38.2% (@RM8.16)
So, my suggestion is for those who has higher risk tolerance level can start to accumulate at around RM8.32 (50% retracement) and those with lower risk tolerance level can accumulate at RM8.16 (38.2%)
This opportunity will only presents itself if the retracement reaches these levels.
Anyway, stock market is fraught with uncertainties and without uncertainty stock market will not be so complex.and challenging.
No comments:
Post a Comment