National Geographic
Boustead is a good dividend paymaster. It pays dividend quarterly and the last dividend of 12 cents tax free was paid on 30th December 2010. I expect Boustead to pay another dividend in March 2011.The price has appreciated quite a lot and currently it has gone into a consolidation stage. Currently it is trading at about RM5.50 which may be an opportunity if the consolidation is about to end. If we look at the support line it is now sitting at the immediate support line and if this support is broken down on further consolidation it may drop to a level near to RM4.92. My opinion is that at RM4.92 it has good value and I will buy it for investment.
The above Boustead chart is added to highlight a crucial moment. Crucial because today (8th Feb 2011) it close at RM6,03 which barely broke through the resistance, with good volume. Tomorrow will be even more crucial because if the strength of Boustead maintain its upward momentum and close even higher than RM6.03 (with volume) then RM6 will be the new support level and the price will go higher from here otherwise if the closing price on 9th February 2011 is below RM6.03 then it is a failed breakthrough. So open your eyes wide tomorrow.
In August 2010 Keck Seng accepted the general offer of Parkway shares and made some RM260 million gain.
On 30th November 2010 Keck Seng proposed a one (1) bonus share for two (2) shares held.
Upon announcement share price gap up and eventually hit the upper limit at RM7 of the uptrend channel.
Thereafter, its price went into consolidation which I think is partly due to the sale of 134,100 treasury shares in the open market from 13th January 2011 to 19th January 2011. Will there be any further sale? Your guess is as good as mine because Keck Seng still has 1,840,300 treasury shares. If the sale were to continue there will be further weakness. The weakness may be a blessing in disguise because this may give opportunity for me to accumulate some so that I can hold them to enjoy the bonus issue which is to be completed by first quarter of 2011.The current price is RM6.42 and a good entry may be RM6.30 and if this cannot hold RM6 will be a better entry.
Keck Seng is a well managed company and holds some valuable assets like 4.9 million shares in PPB Group and 2.8 million shares in Chin Teck Plantations
The above Keck Seng Chart is just added (8th February 2011) to view how the consolidation as I mentioned above has panned out. The consolidation, according to my opinion, has taken its course and has thus formed a base for the next upward move. RM6.34 is now the immediate support should the upward move fail to take off.
I just bought at RM6.62 for a long to medium term ride otherwise if I am proven wrong I intend to stop out at RM6.34 for a 4.5% potential loss.. If the ride up is in my favour I will watch for the RSI to hit above 70 before contemplating to take profit.
Malayan Banking Bhd (Maybank) is acquiring a 44.63% controlling stake in Singapore-listed stockbroking firm KimEng Holdings Ltd in an all cash deal worth S$798.44 million (RM1.9 billion) ..This has brought Maybank to the attention of more investors and has since came out the consolidation at RM8.50 level.
Maybank chart above shows that it is following the uptrend channel and after a good spike it is in consolidation mood right now. My guess is to watch out for the price to weaken a little further, say below RM8.80 level to accumulate and sell it if the price hit the upper channel into the future
Crude palm oil (CPO) price is rising in tandem with Crude Oil price. Arising from there, KLK has a good revaluation by investors recently. KLK is well managed and is at the moment in the right sector of rubber and CPO, which both enjoy buoyant commodity prices currently.
From the chart above, the initial climb is more gradual following the long term support line of S1S2.
Recently, it went over-drive to form a steeper uptrend channel C1C2, with a small hook down now.
With this chart formation, it will be an opportunity to enter a buy order around RM21.90, shown by the horizontal support line. Batu Kawan is a cheaper proxy to KLK. In terms dividend yield Batu Kawan is superior but it has lower market liquidity. (you may refer to an earlier posting on Batu Kawan on 26th December 2010)
PPB Group was beaten down partly due to the poor performance of Wilmar. PPB Group owns 18.4% of Wilmar which is listed in Singapore and now it is trading at a depressed price of about S$5.51 from the recent peak of S$7.14. The latest significant drop in Wilmar's profit will no doubt adversely affect PPB Group bottomline but I believe that PPB Group will still enjoy a very profitable year.. Anyway, without the problem of reduced Wilmar's contribution, PPB Group will not be trading at a discount to the recent peak of RM19.58 (refer to chart above)
Next, we need to look at the second chart for any sign that this counter is about to turn up.
There is a golden cross formation at MACD few days back (28 December 2010)
Both RSI and Stochastic are hooking up, which suggest that this counter is about to move up at least temporarily. The 50% Fibonacci retracement is at RM18.10, which is the immediate resistance and once penetrated it will probably move up to the 38.2% retracement which is at RM18.45
It should be an opportunity to buy at least some when you see weakness say around RM17.30 or even RM17.40
The chart shows that Bursa has a good chance to at least turn up in the short term fom here.
This counter is co-related to the volume of the market. As the market is having good volume lately there is a good chance for this counter to turn up at least for the short term.
The three (3) arrows shown in the MACD, RSI and Stochastic chart seem to confirm that what I observe is true. MACD is about to form the golden cross and both RSI and Stochastic are in the lower area.
So it will be a good strategy to buy on weakness from now and sell it off when it hit the resistance shown by the upper parallel line.
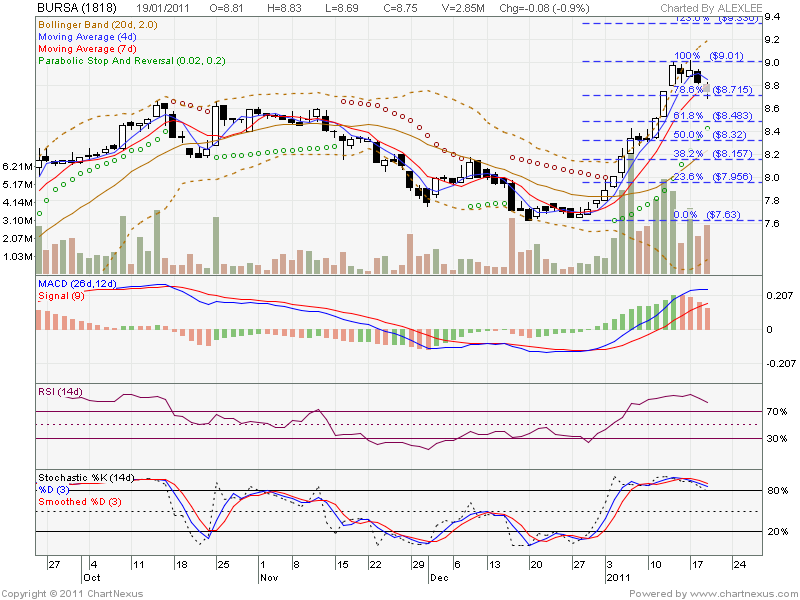
This Bursa chart is added on 19.1.2010. It is a holiday to commemorate Thaipusam, so I am free to look at the chart I posted on 30th December 2010.
The price of Bursa has so far performed well from the day I suggested and now has started to turn down.
In fact it pierced through the upper resistance line then only it started to consolidate.
From now on, will there be a buying opportunity? To find the answer let us look at the Fibonacci retracement.
Right now it has retraced 78.6% (@RM8.72). The next retracement is at 50% (@RM8.32) and if this break down it may retrace to 38.2% (@RM8.16)
So, my suggestion is for those who has higher risk tolerance level can start to accumulate at around RM8.32 (50% retracement) and those with lower risk tolerance level can accumulate at RM8.16 (38.2%)
This opportunity will only presents itself if the retracement reaches these levels.
Anyway, stock market is fraught with uncertainties and without uncertainty stock market will not be so complex.and challenging.


